
Catalytic partial oxidation of methane in a monolith
Modeling of a CPOX-Reformer using DUO, the coupling of OpenFOAM and DETCHEM
The work presents the new software tool DUO for the CFD-modeling of multiple combined fluid and solid regions. The solids may be coated with catalytic active material. DUO stands for the coupling of the open source CFD-code OpenFOAM and the purchasable software package DETCHEMTM. The tool exhibits two features.
Firstly, a shared library, which was made out of several parts of DETCHEM, was coupled to a multi-region OpenFOAM solver. This library provides thermophysical properties and the reactions terms of gas-phase / surface reactions using detailed chemistry to the CFD solver. Secondly, it is possible to model 3D structured catalysts consisting of many channels. The flow inside the straight channels is calculated with stand-alone DETCHEM executables by applying detailed gas-phase and surface chemistry.
In the present work, the performance of the tool DUO is verified by the modeling of a CPOX (Catalytic Partial Oxidation)-reformer, which is operated with the fuel methane. The calculation domain includes one fluid region and two solid regions.
The calculation of a quarter of the reactor geometry including a catalyst part with 77 channels leads to encouraging results. The results show that it is possible to capture the flow field, the species concentrations and the temperature fields of the flow and solid structures very well. However, the results are strongly dependent on the thermal boundary conditions and suggest the use of a radiation model. The characteristics of the influence of radial heat loss to the conversion process can be determined. In summary, the results confirm that DUO is a practical tool, with possible application in the design of technical processes, which utilize structured catalysts or any other arbitrary shaped configurations (e.g. coated foams).
1 Introduction
Three dimensionally structured catalysts are used in many technical processes, including pollution reduction (e.g., conversion of nitric oxides from combustion engines or power plants). Design and optimization of catalytic converters is challenging due to the complex interaction between chemical reactions and mass and heat transfer. Today, the use of simulation tools helps to understand the processes and to shorten the development time. But there are some constraints.
Reformers that are based on monolithic structures include many equally sized small channels. To resolve these structures with Computational Fluid Dynamics (CFD) methods in detail, grids with high spatial resolution are needed, which leads to large counts of cells. The catalytic reforming kinetics of practical fuels (e.g. diesel) depend on gas-phase and heterogeneous reaction mechanisms, which may involve thousands of elementary reactions. For each of the hundreds of species, a transport equation in a CFD-code has to be solved. The direct coupling of complex chemistry at this level would lead to too large simulation times for practical use in the design process. Therefore, the development and investigation of reformer systems using solely a common CFD code is not suitable. Beyond that, the licensing of a commercial CFD code is very expensive and not suitable for small companies.
2 The Tool Duo
As mentioned above, the task is to model a reformer based on a monolithic structure. The approach exploits the structure of reformers in which the combined gas-phase and surface chemistry is confined within geometrically simple tubes or channels.
We present a newly developed tool, named DUO. DUO stands for the coupling of the two computer codes DETCHEM Und (German for ‘and’) OpenFOAM and is a synonym for the joint utilization of these two programs. OpenFOAM is an open source CFD tool, which enables the calculation of three-dimensional fluid and solid regions. By being open-source, OpenFOAM offers users complete freedom to customize and extend its existing functionality. DETCHEMTM is a purchasable package of tools specifically designed for the modeling and simulation of reacting flows based on elementary step mechanisms, particularly for heterogeneous systems such as catalysis, materials synthesis and fuel cells. The basic idea is to combine the advantages of the two programs. The simulation tool DUO is the gateway between the two codes.
3 Numerical Set-up
3.1 Chemical Mechanism
We used a detailed surface reaction mechanism, which was developed for the partial oxidation and autothermal reforming of methane over rhodium. The mechanism includes 20 species and 38 reactions. The mean-field approximation was applied for modeling the surface chemistry. No additional washcoat model was used. It was already shown in literature that reactions in the gas phase can be neglected for the given operational conditions, which was also proven by additional calculations.
3.2 Computational Domain and Grid
The Calculation domain comprises a quarter of the cross sectional area of the reactor tube (see Figure 1). The number of channels in the catalyst and in the FHS is 77 in each case. For simplicity, we neglected the rounding of the channel edges in the monolith due to the washcoat and used a quadratic shape for the CFD-grid. The free height of every channel is HChannel = 877 mm. A block-structured grid with ca. 2700 blocks and a size of ca. 3,000,000 prism cells was generated. The use of a block-structured grid needs an extensive manual gridding process. However, the use of a block-structured grid with hexahedral cells leads to more accurate results and is numerically more stable in comparison to the use of an tetrahedral grid. As described above, all regions excluding the channels in the catalyst are solved with OpenFOAM, whereas the channels of the catalyst are calculated using the external coupling to DETCHEM.
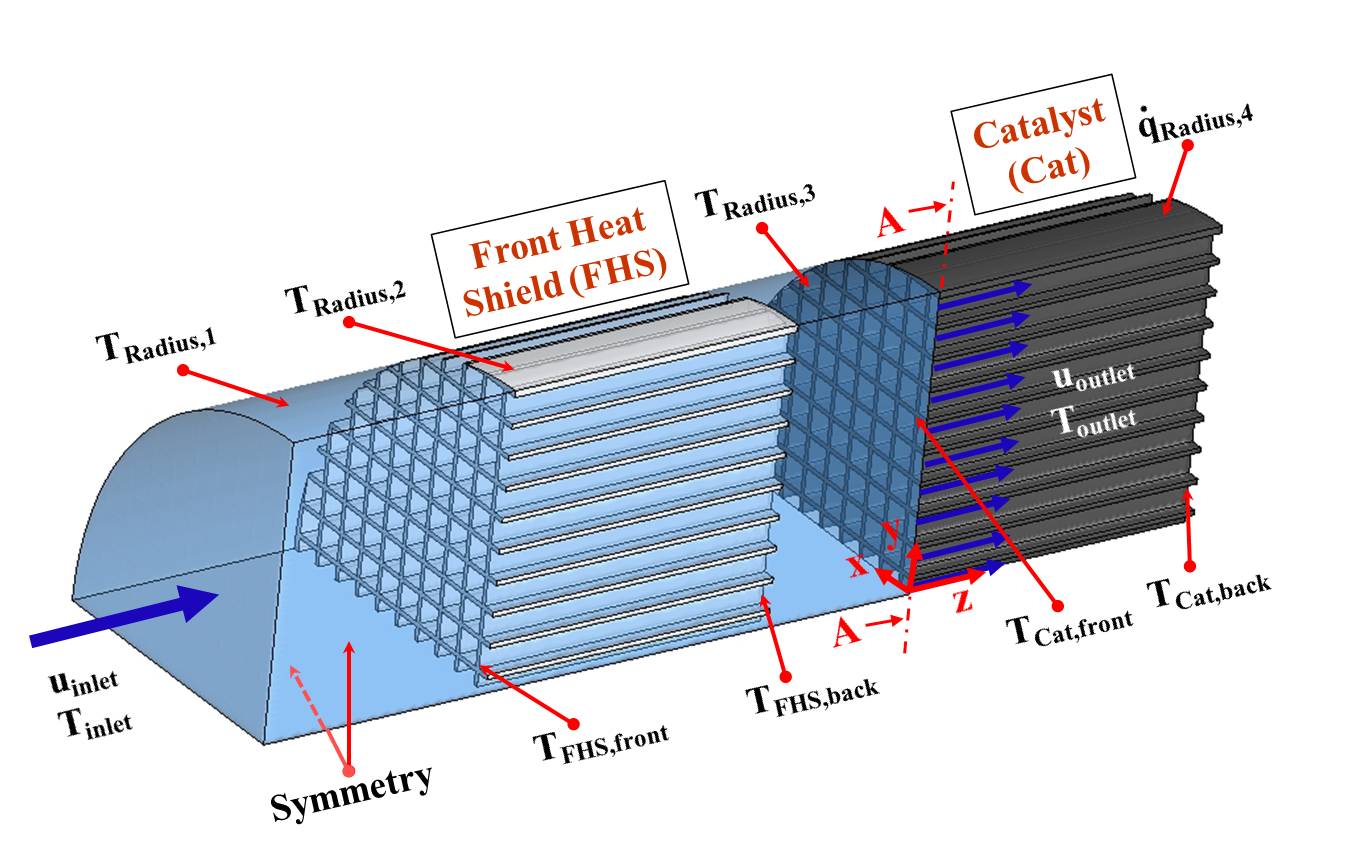
Figure 1: Calculation domain three with boundary conditions.
3.3 Boundary Conditions
The volume flux in the experiments was 4 SLPM (Standard Liters Per Minute). We used an estimated temperature of Tinlet = 463 K (temperature of the oven) at the inlet, resulting in a velocity of uinlet = 0.329 m/s for a pressure of pin = 1 bar. The investigations were carried out for a ratio of C/O = 1.0 with a dilution of 80 vol.% nitrogen (mole fraction of methane yCH4,in = 0.133 mole/mole).
The heat balance of the system is depends strongly on radiation effects, which are particularly important for the heat exchange between the back side of the FHS and the front side of the catalyst as well as for the outer surfaces in radial direction. The OpenFOAM based multi-region solver used does not allow the consideration of radiation effects between solid surfaces of the calculation domain. Therefore we fixed the temperature at the front and the back sides of the FHS and the catalyst. The temperature at the front and the back side (with respect to the flow direction) of the FHS were estimated to be TFHS,front = 490 K and TFHS,back = 630 K. The temperatures at the front and the back side of the catalyst were taken from the measured wall temperatures (TCatalyst,front = 976 K and TCatalyst,back = 906 K). The temperatures at different sections of the radial surfaces of the calculation domain were estimated. For the radial heat loss of the monolith due to radiation we coded included simple model to the code.
The Reynolds number of the flow in the reactor tube and in the channels of the solids was always small enough to guarantee laminar flow conditions.
4 Some Results
4.1 Temperature and Flow Field
Figure 2 shows the temperature field. Although only a quarter of the reactor was considered, the plot shows a three-fourth configuration to achieve a better visual impression. One quarter of the catalyst was removed to have a look on the xy-plane at z = 0.
The plotted streaklines indicate that the velocity field in front of the FHS and between FHS and the catalyst is relatively homogeneous. The fluid leaves the CFD domain at the inlets of the channels of the catalyst.
The temperature inside the FHS increases in axial and radial direction. The temperature field indicates that the mixture is heated up in the channels of the FHS from 463 K at the flow inlet to approx. 600 K. The slice, which is positioned at the outlet plane of the flow field (xy-plane at z = 0) shows a complex temperature distribution. In the center of every quadratic inlet region for the catalyst-coated channels, the temperature is smaller than towards the walls. The temperature in front of the closed channels, which are located next to the reactor wall, is larger than in front of open channels. The higher temperature in this region is due to the heating of the fluid by the reactor wall. Additionally, the convection towards these regions is smaller and so the upstream conduction of heat from the front side of the catalyst has a stronger influence. The temperature field inside the solid part of the catalyst shows a maximum near the inlet section. The temperature level decreases with the z coordinate. As the catalyst loses heat in radial direction due to the radiation boundary, the temperature decreases towards the outer surface in radial direction.
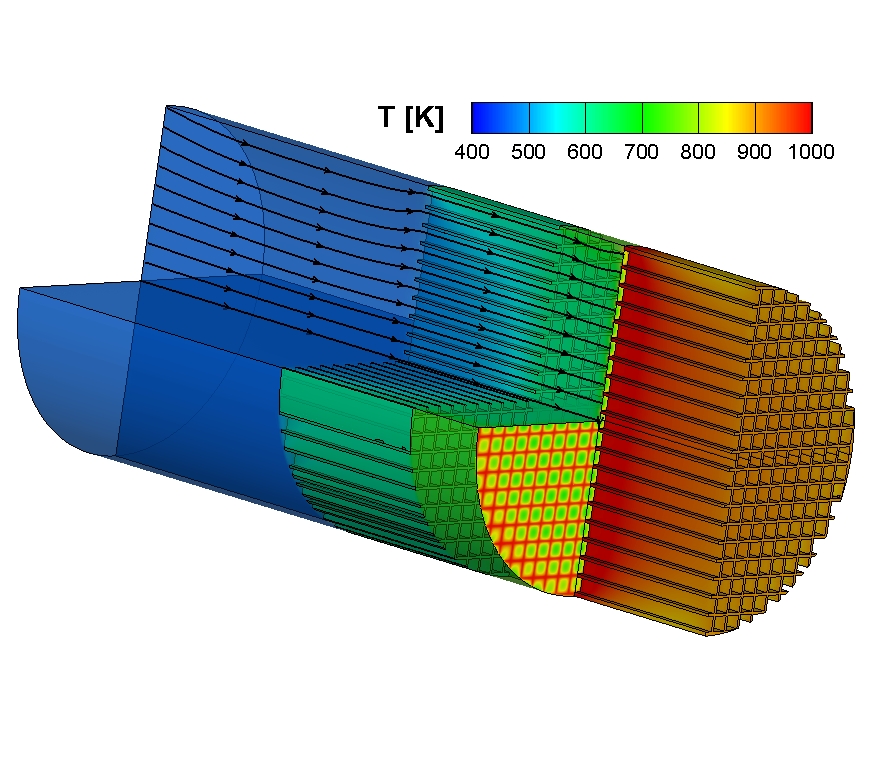
Figure 2: Temperature field of the fluid part and the two solid bodies. Additionally, some streaklines are plotted.
4.2 Comparison Experiment/Simulation
Figure 3 shows the comparison of measured and calculated data as a function of the z-coordinate for a channel, which lies between the center and the surface of the monolith. The calculated data of the gas phase was extracted from an axis, which is positioned in the center of the catalytic channel.
The calculated temperature of the wall inside the channel shows a good agreement with the measurement (Figure 3, upper picture). From this we can conclude, that the heat transfer inside the solid and between gas phase and wall is captured well. However, the comparison of the temperature of the gas phase shows some differences (Figure 3, lower picture). With the chosen wall temperatures at the front and back face of the FHS (TFHS,front and TFHS,back) the measured and calculated temperatures of the gas phase agree satisfactorily inside the channel of the FHS. The increase of the gas temperature in the gap between FHS and catalyst takes place earlier with respect to the z-direction for the measured data. The calculated temperature firstly remains constant and increases not before 1.5 mm upstream of the catalyst. Over the first 3 mm inside the catalyst-coated channel, the calculated temperature is higher than in the experiment. In this region the chemical process is dominated by exothermic reactions, however endothermic reforming reactions occur simultaneously. In the following section the temperature decreases, as the chemical process is dominated by endothermic reactions. The solid walls of the catalyst serve as a heat distributor, in which the heat is transported away from the front part of the catalyst in axial direction. Farther downstream the calculated and measured gas phase temperatures are nearly the same and coincide with the wall temperature. Generally, the measured temperature shows smaller gradients in the z-direction than the calculated temperature. It cannot be ruled out that an axial smearing of the temperature profile occurs due to the measuring technique. For the measurement, the thermocouple is placed inside a glass capillary to prevent contact of the temperature probe with the reactive wall. Apparently, this leads to an axial distribution of heat in the gas phase. The profiles of the measured molar concentrations and the results of the calculations point out, that the impact of molecular diffusion effects upstream of the front side of the catalyst is restricted to a small region of about 2 mm. As the Lewis number is around one, the same holds for the conduction of heat.
The comparison of calculated and measured concentrations reveals, that the conversion of methane is too small in the simulation. The concentrations of all products are smaller than in the experiment. However, a part of this deviation can be explained by the fact, that the insertion of the suction probe leads to a smaller volume flux in the channel. Therefore, the residence time increases and so does the conversion. Consequently, the conversion in a channel without probe is smaller than the measurement indicates.

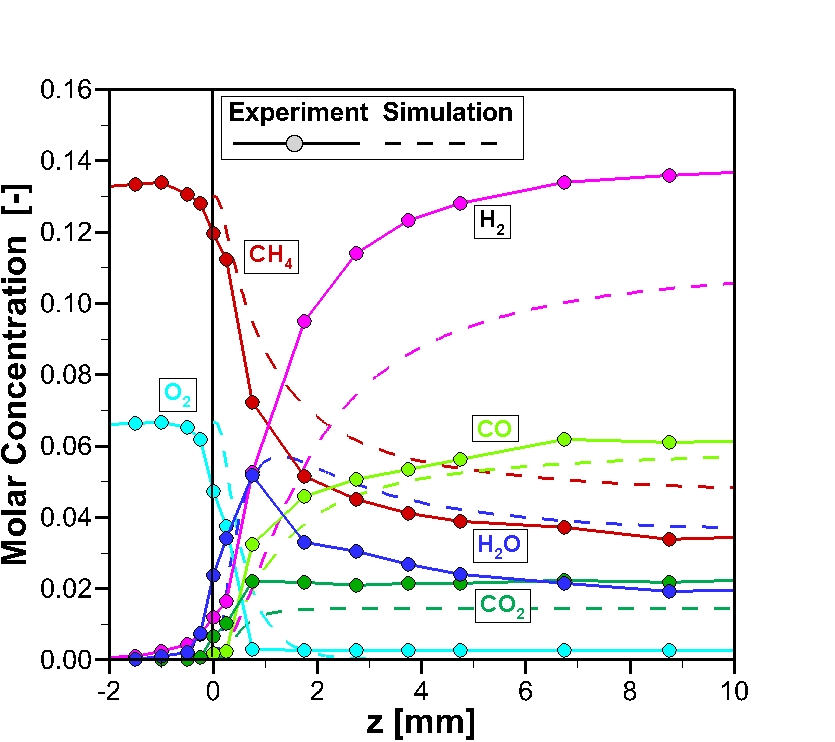
Figure 3: Comparison of experiment and simulation (TCat,front = 976 K). Upper part: Temperature of gas mixture and of catalyst surface inside the channel. Lower part: Molar fractions of reactants inside the channel of the catalyst and 2 mm upstream.
Figure 4, shows the results for the calculations in which the fixed temperature at the front surface of the catalyst was raised by 50 K (TCat,front = 1026 K instead of 976 K). The measurement error of the temperature of the catalyst wall is estimated to be about 5%, which would be 50 K at a temperature level of 1000 K. Now, the level of the calculated wall temperature is higher than that of the measurement (Figure 4, upper picture). The largest deviation can be seen in the first millimeter, which is the region in which the peak of the wall temperature appears. Consequently, the level of the gas temperature increases. The conversion of methane also increases (Figure 4, lower picture), as the higher temperatures promote the endothermic reforming reactions. Now, the calculated concentrations coincide much better with the experimental data.
The strong influence of the variation of temperature at the front side of the catalyst indicates how sensitive the calculation results are to a variation of the thermal boundary conditions. Thus, the system is strongly dependent on the heat balance of the solid catalyst. For a calculation of the configuration it is indispensable to consider radiation effects at the font and the back faces of the catalyst and to include a detailed radiation model.
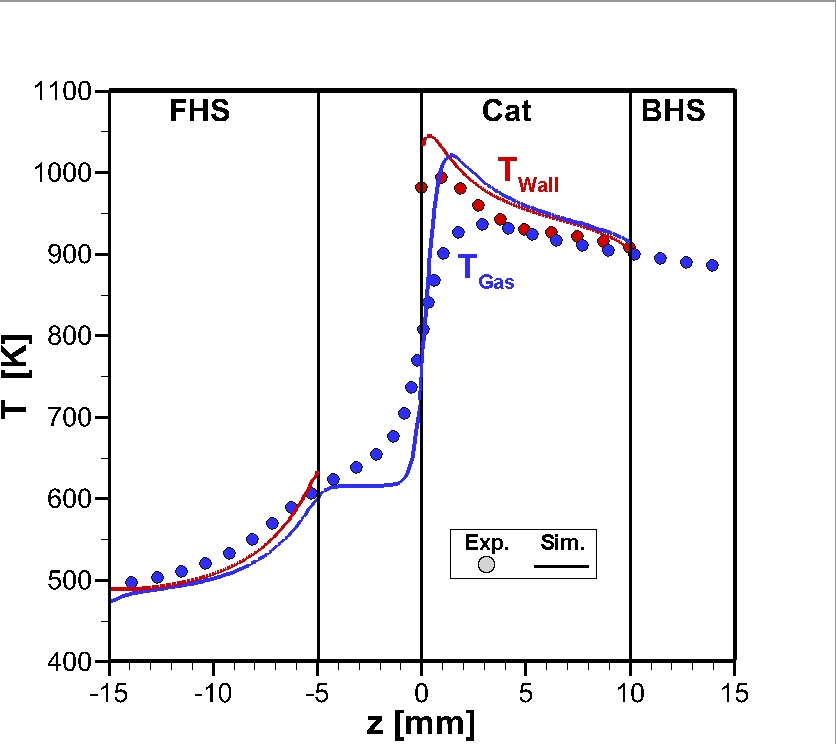

Figure 4: Comparison of experiment and simulation (TCat,front = 1026 K). Upper part: Temperature of gas mixture and of catalyst surface inside the channel. Lower part: Molar fractions of reactants inside the channel of the catalyst and 2 mm upstream.
The influence of the radial heat loss on the conversion can be captured well. These results can be found in the original paper.